
CVm6A is a relational database containing a set of interactive MySQL tables, constructed by Laravel, an open-source web framework based PHP (https://laravel.com) and JavaScript library. All the data, including gene type, gene region, subcellular location, conditions associated with m6A peaks were organized in CVm6A and can be searched and browsed in the interface. Google Chrome browser is recommended to view the CVm6A. If the table cannot be loaded, please clear the cookies of the browser.
1. Browse page
In this page, users can browse all m6A peaks from all cell lines. All information, including the peak region, strand, enrichment score, gene symbol, gene type, gene region, subcellular location, cell line and condition for each peak are displayed in the table (Figure 1). The Peak region and gene symbol links to the visualization page of m6A peaks distributed in this gene.
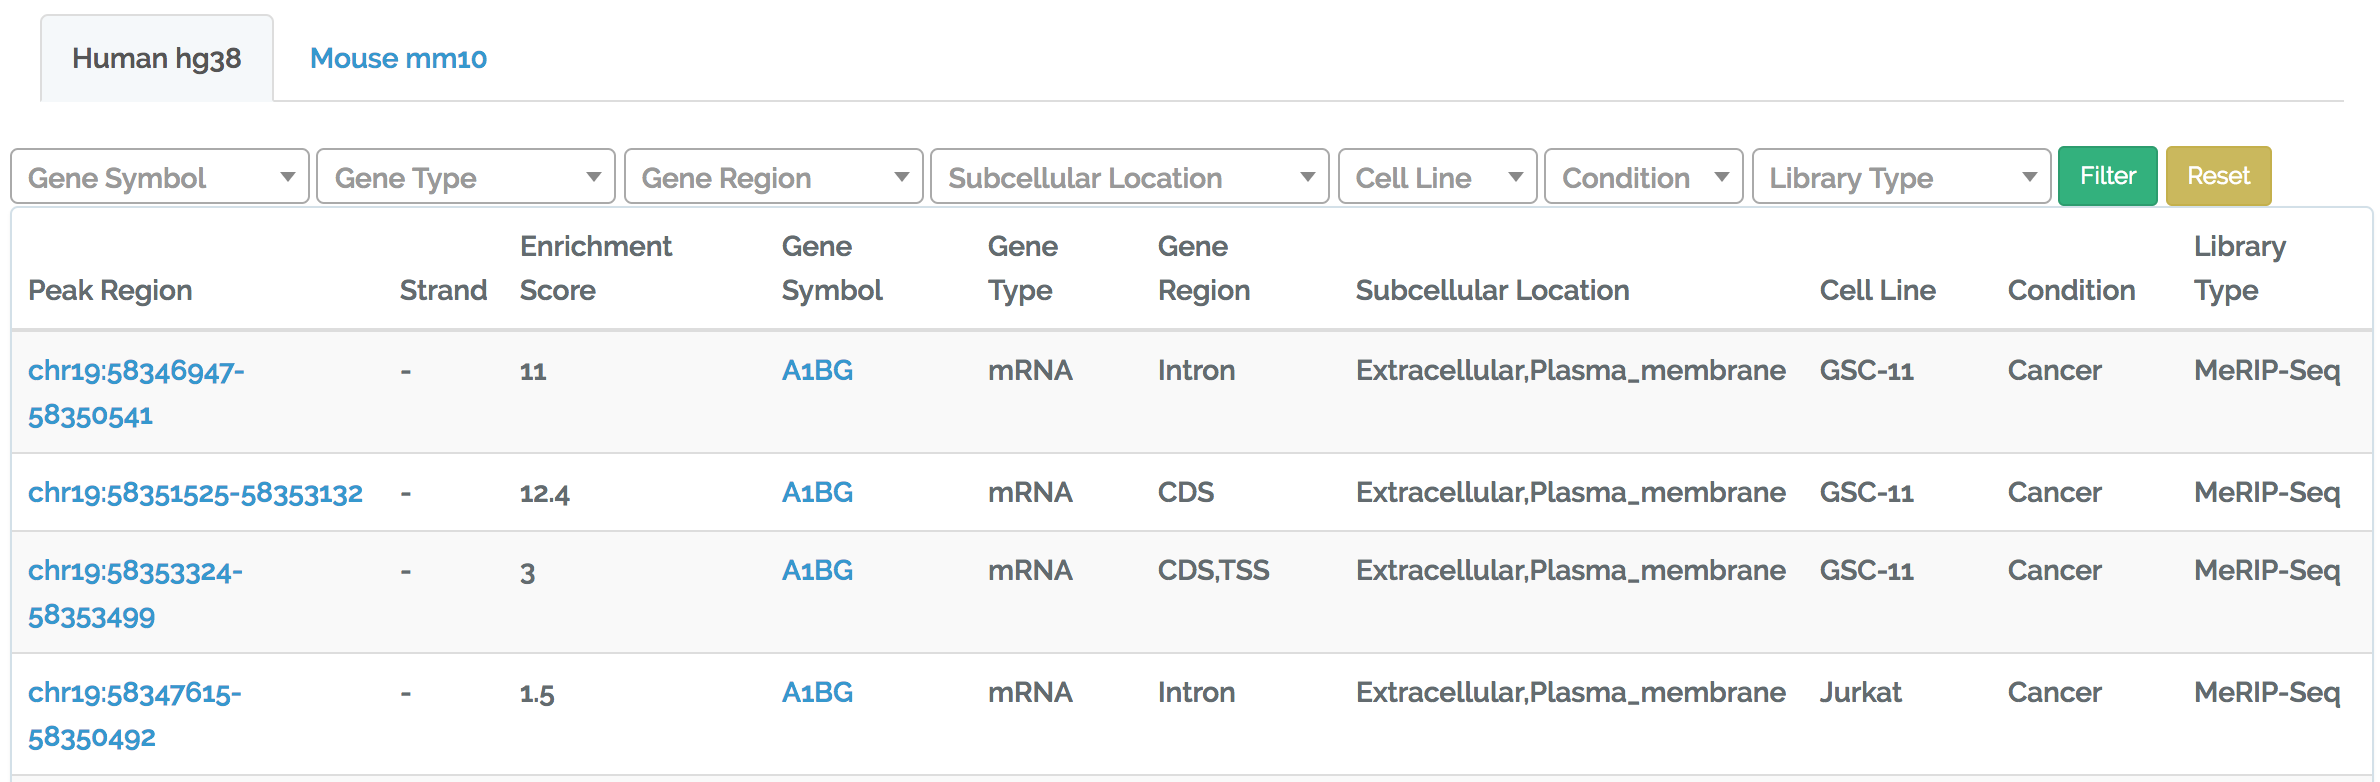
Figure 1. Browse page. All m6A peaks in gene and cell line can be viewed by peak region, gene symbol, etc.
2. Search page
In this page, users can search m6A peaks by gene symbol, cell line or genomic coordinates. While users select gene symbol or cell line, all peaks in this gene or cell line will be displayed in tables below. And search by genomic coordinates supports fuzzy search. All peaks surrounding the input coordinates will be displayed (Figure 2).
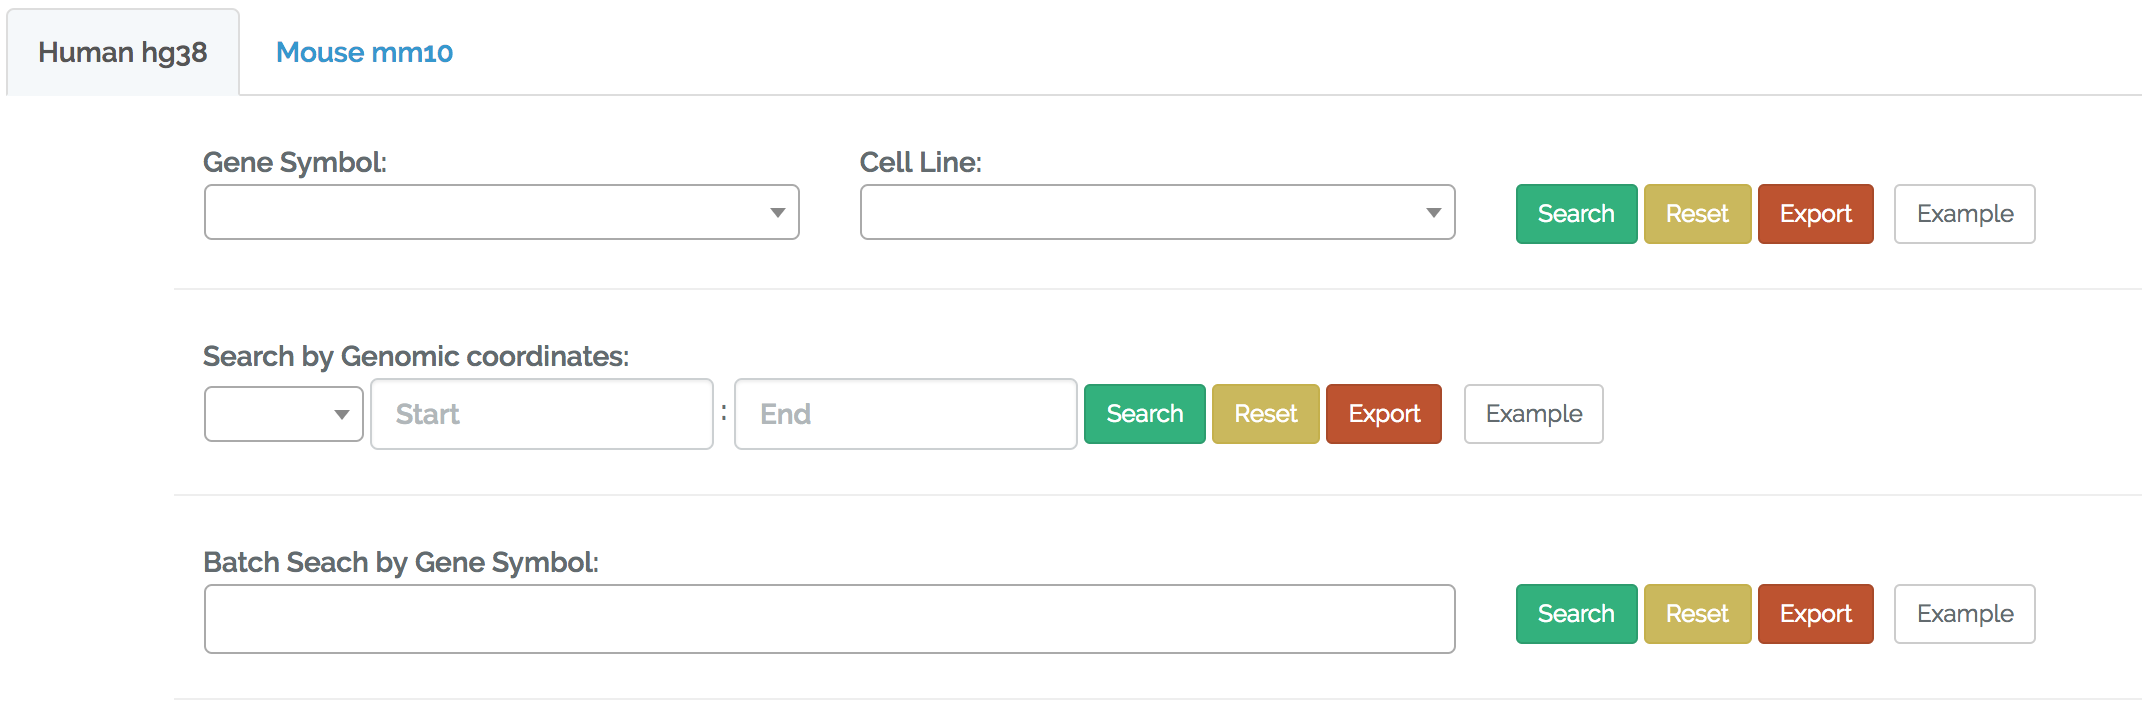
Figure 2. Search page. Users can search all m6A peaks in special gene and cell line. The Search function by genomic coordinates supports fuzzy search of all peaks surrounding the input genomic region.
3. Visualization page
In this page, users can view all m6A peaks distributed in selected annotated gene. All peaks in current gene are displayed with dark yellow color. If user selects one peak at the browse page, then the selected peak is displayed with red color in the figure. In the top left corner, user can also select special cell line in the search box. All peaks in the selected cell line are displayed with brown color in the figure and table. The summit of each peak is determined according to the enrichment score. The gene structure with exon (blue box) and intron (gray line) is displayed below peaks. If the selected gene has more than one transcript, all transcripts are displayed. The relative location of each peak and the annotated gene are placed according to genomic coordinates. Mouse hover over on each peak can display the peak region, enrichment score, gene region, subcellular location, cell line, condition of this peak. The table below the figures includes the detailed information of all peaks in the selected gene (Figure 3).
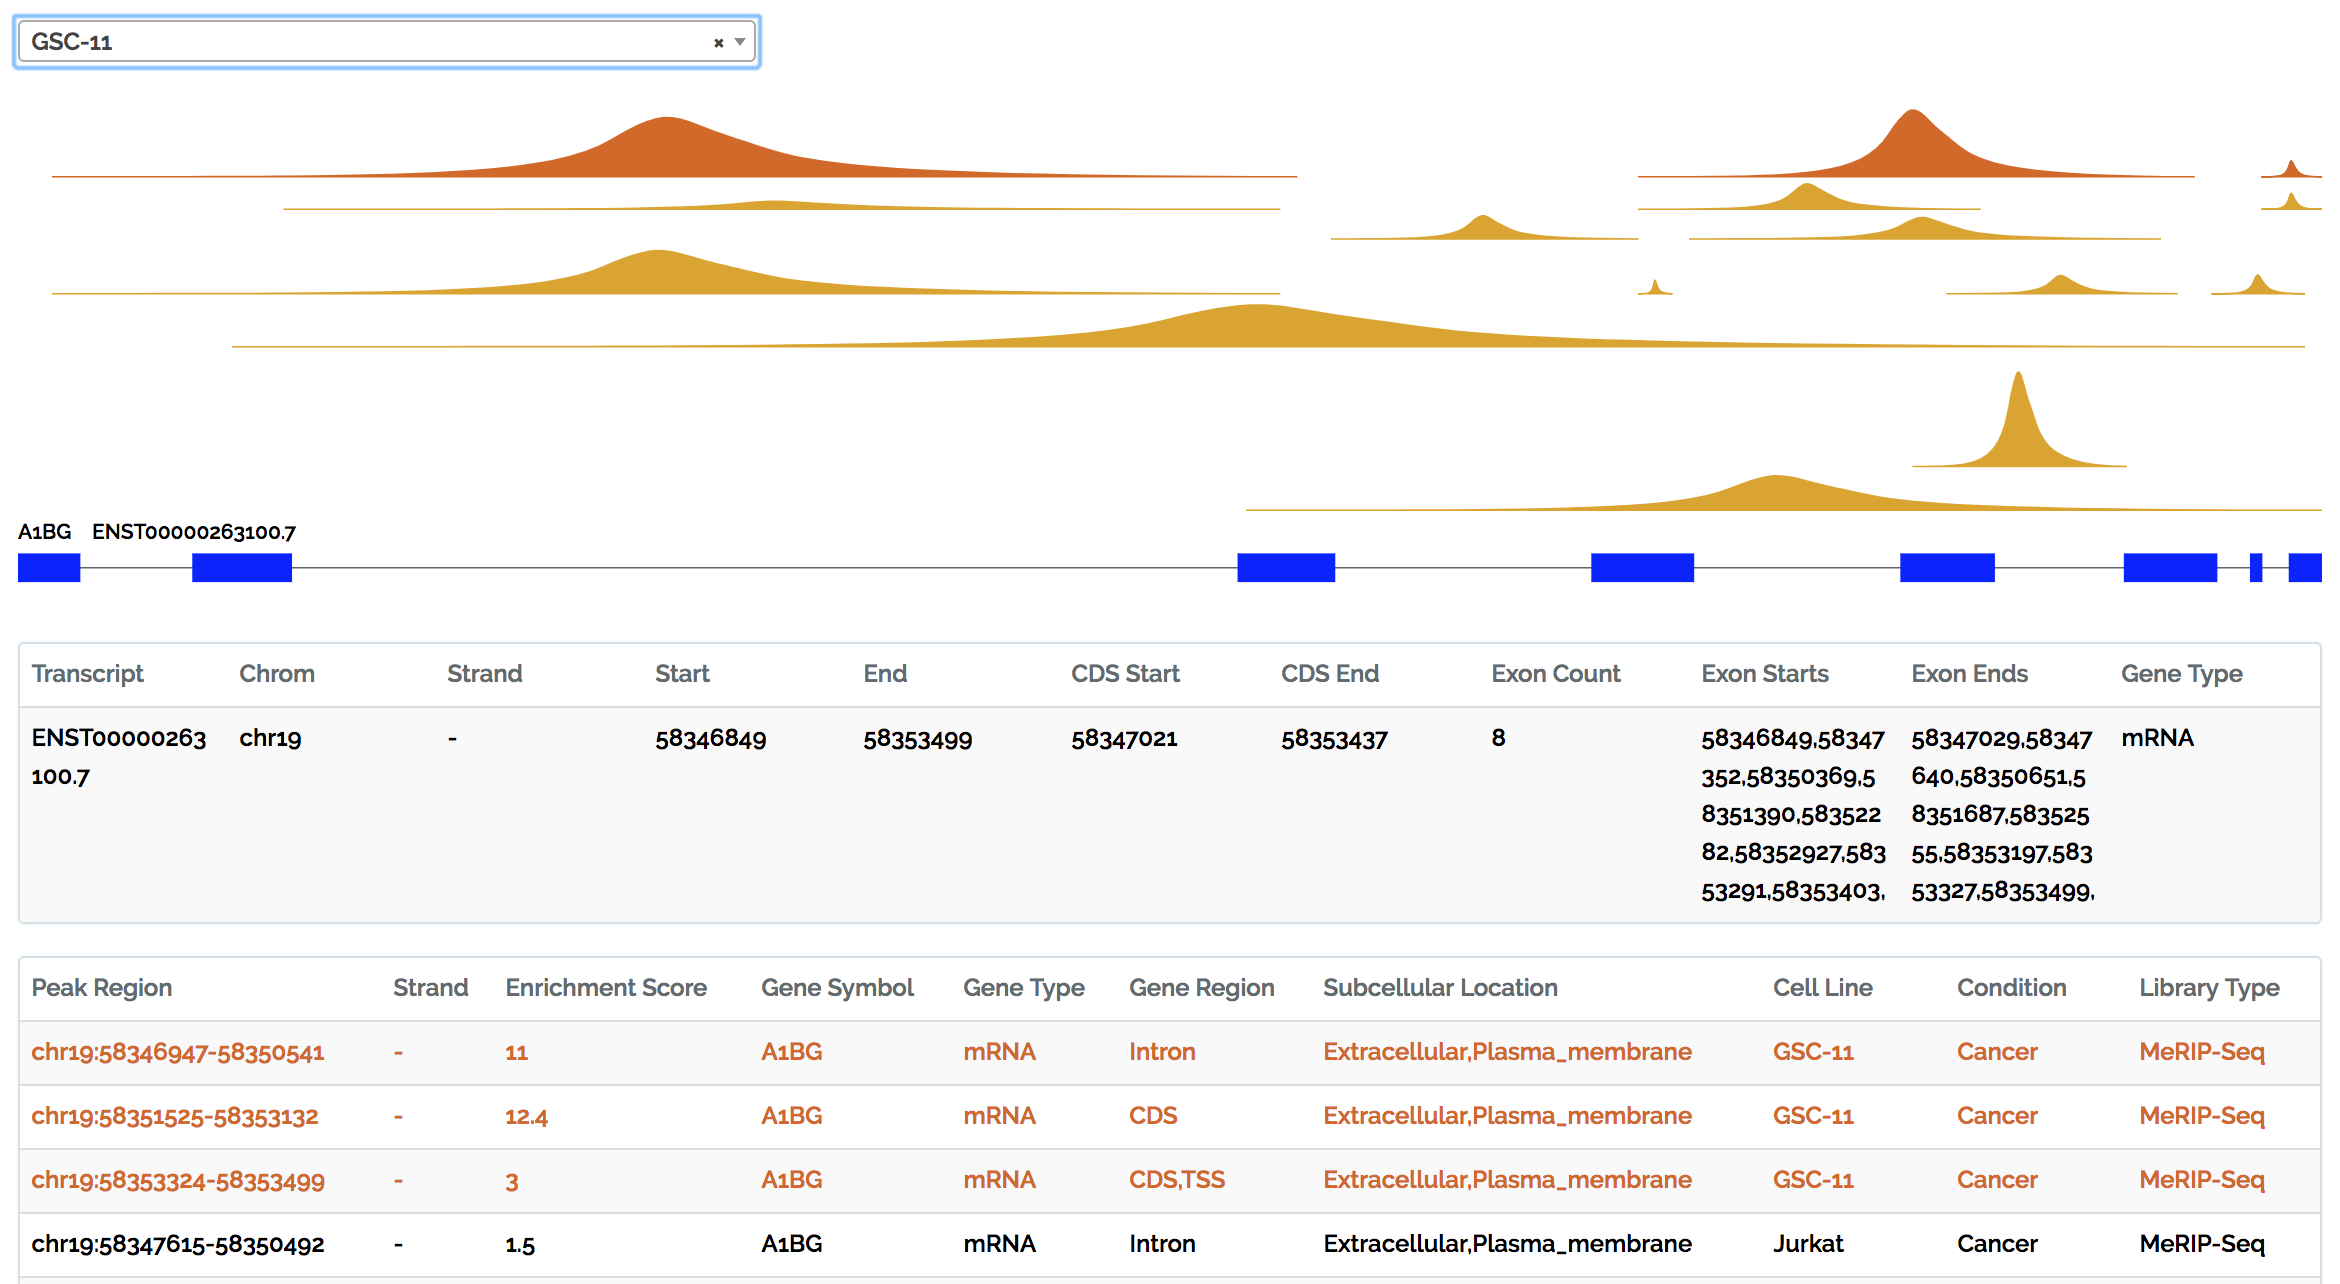
Figure 3. Visualization page. Image of all m6A peaks in selected gene are displayed with dark yellow color. Peaks in selected cell lines are displayed with brown color in figure and table. Annotated gene and transcripts structure are displayed in blue color (exon) and gray line (intron). Detailed tables corresponding to those peaks are displayed below.